Chemical Structure Profiling
The NeuroDeRisk IL Profiler KNIME node developed by Inte:Ligand enables in silico screening of chemical structures against a panel of 3D-neurotoxicophore models developed in the NeuroDerisk project using algorithms from the program LigandScout developed at Inte:Ligand. The models represent targets and/or neurotoxic adverse outcomes.
Input
To make the predictions with the NeuroDeRisk IL Profiler, chemical structures are required. The NeuroDeRisk toolbox provides a number of different input nodes for reading chemical structure data that can subsequently be used as an input for profiling/prediction workflows. These nodes are called Readers and can be found in the Node Repository of KNIME under the Inte:Ligand NeuroDeRisk subfolder I/O (input/output). They are also included in the ready to use workflow. Currently supported options are
- Mol (MDL chemical table file format)
- Mol2 (MDL chemical table file format)
- SDF (Structure-data file format)
- SMILES (Simplified molecular-input line-entry system; SMILES string)
- CSV (comma-separate values files; Must contain a column with SMILES data)
- XLS (Microsoft Excel format. Must contain a column with SMILES data)
- LDB List (LigandScout Database file format)
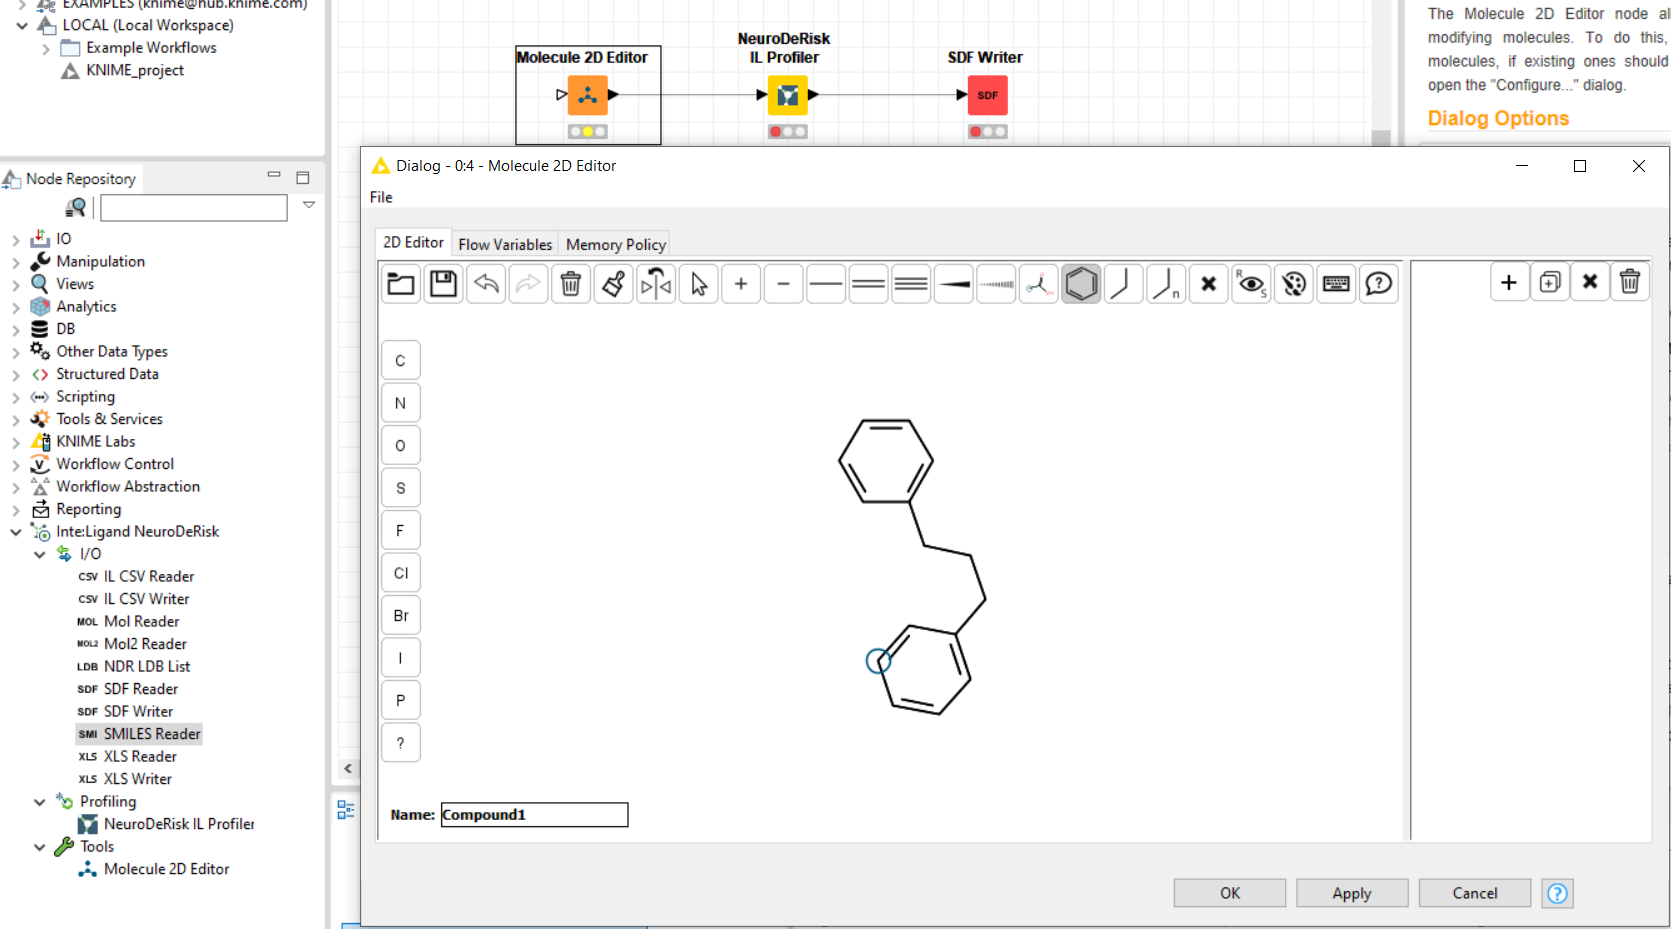
- Molecule 2D-Editor
The Molecule 2D-Editor supports the creation of chemical structures interactively. It provides a feature-rich graphical user interface for drawing molecules from scratch, or editing molecules imported via the input port. Copying SMILES codes from other sources such as PubChem or Wikipedia and pasting them into the GUI is also supported. Multiple SMILES codes can be added to the editor to create a list of structures to be used as input for the NDR IL Profiler node. Names can be given to each structure by typing into the text box next to Name.
NeuroDeRisk IL Profiler
The NeuroDeRisk IL Profiler node includes a collection of 3D-pharmacophore models that were developed as part of the NeuroDeRisk project as well as proprietary algorithms developed at Inte:Ligand for making predictions. There is a separate documentation section with information about the models.
To make in silico predictions with the NeuroDeRisk IL profiler node, connect a chemical structure input node (a reader or the Molecule 2D-Editor) to the profiler, and open it's Configure dialog by double-clicking the node. Indicate the path to the location of the chemical structure file to be used for input or draw the molecular structures to be used as input into the 2D-molecule editor. Execute the nodes by selecting NeuroDeRisk IL profiler and pressing F7 or using the Execute selected node button in the KNIME toolbar.
By default, the NeuroDeRisk IL profiler will screen all of the input molecules against all models that are currently available. Customized selections of models for profiling can be made by a moving model(s) between the right and left boxes using the arrow buttons. In addition, models in the right box can be filtered using the text box. The following animation illustrates the model selection process:
Profile Prediction Results
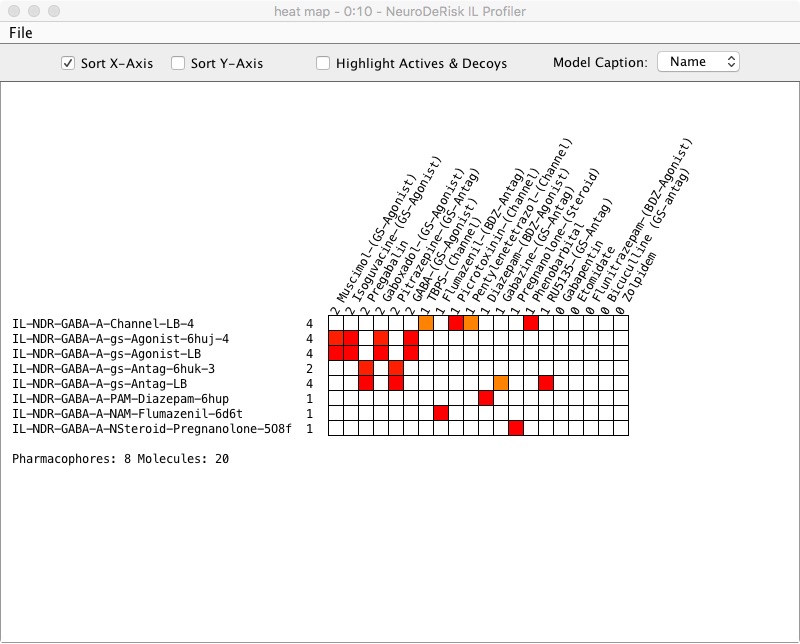
The NeuroDeRisk IL profiler node outputs a molecule table that, by default, contains all input molecules along with profiling prediction results and a heat map. The Output molecule table includes molecule name, 2D-structure, and relative pharmacophore fit scores (value range 0 - 1) for each model that retrieved the chemical structure. The value 1 represents a perfect fit to the model. The options can be accessed by right-clicking on the output port of the NeuroDeRisk IL profiler node.
Selecting View: heat map will display a heat map of the profiling results. In the heat map pharmacophore fit scores are represented by colors. Different colors indicate the fit to the model (red-best fit, orange lower fit score, yellow-lowest fit score, white -no fit to the model). Red indicates a potential high likelihood of the predicted outcome. Orange and yellow indicate a potential likelihood for the outcome but with a lower fit to the query model compared to red. White indicates that there was no match and a low likelihood of the outcome based on the model. The model names on the Y-axis can be sorted by the number of molecules retrieved by ticking the Sort Y-Axis and the molecule names listed on the X-axis can be sorted by the number of pharmacophore models matched by ticking the Sort X-Axis box. Highlight Actives & Decoys is useful when chemical structure datasets added in the input node have been designated as actives and decoys. The resulting heat map will be colored green and red, respectively when the box is selected. The heatmap can be exported using the File pull-down menu in PNG format.
Using Writer nodes the profiling/prediction results can be saved to a variety of output formats. Provided output nodes can be found in I/O section of the Inte:Ligand NeuroDeRisk extensions in the Node Repository. They are also included in the ready to use NeuroDeRisk IL Profiler workflow. Supported output formats are:
- Mol
- Mol2
- SDF
- SMILES
- CSV
- XLS
Advanced Settings
In addition to General Settings for pharmacophore model selections, the NeuroDeRisk IL Profiler node contains tabs with access to advanced user settings for conformation generation and screening.
3D-conformations of molecule structures are needed for profiling predictions. The algorithm iCon from Inte:Ligand is used for conformation generation. The option to import precalculated 3D-conformations can be selected by checking the box Skip molecules with existing conformations.
Include input conf. When this is checked the algorithm will include the input conformer in the set of output coordinates. This requires that the input molecule has valid 3D coordinates. (default: enabled)
Apply FAST Settings
Fast Settings are optimized default settings for conformer selection to support faster screening of query molecules. It will output a maximum of 25 conformations per molecule with RMS threshold (0.5) and Energy window settings (15).
Apply BEST Settings
Best Settings are optimized default settings that will output a maximum of 200 conformations per molecule. It may result in longer processing and screening times but will sample more conformational space with RMS threshold (0.8) and Energy window settings (20). It is suitable for flexible molecules (more rotatable bonds).
Retrieval mode
Stopping criteria per compound. Stop after first matching conformation: the screening for a molecule stops when the first matched conformation from the ensemble is found. Since conformations are stored in order of strain energy (lowest first), the reported fit score of the matched conformer with the lowest strain energy will be reported. Get best matching conformation: all stored conformations are examined for the best matching conformation. The fit score will reflect the best matching conformer to the pharmacophore query. The last mode could slow down screening but may be more suitable for comparison of fit scores. (Default: Stop after first matching conformation).
Check exclusion volumes
Enables the consideration of exclusion volumes during the screening process. This option should always be enabled. Disabling this option will result in incorrect predictions.
(Default: enabled)
Include non-matching molecules
If this option is set, the output table, heatmap and the output view will also include molecules that did not match any of the input pharmacophore models. It is useful for identifying molecules with low risk. In cases with a large number of input molecules viewing of the output table and heatmap may be cumbersome.
(Default: disabled)
Include non-matching pharmacophores
If this option is set, the output table and the output view will also include pharmacophore models that were not matched by any input molecules.
(Default: enabled)